VEDILS Learning Analytics


Learning Analytics (LA), according to the Society for Learning Analytics Research is the measurement, collection, analysis and reporting of data about learners and their contexts, for purposes of understanding and optimizing learning and the environments in which it occurs

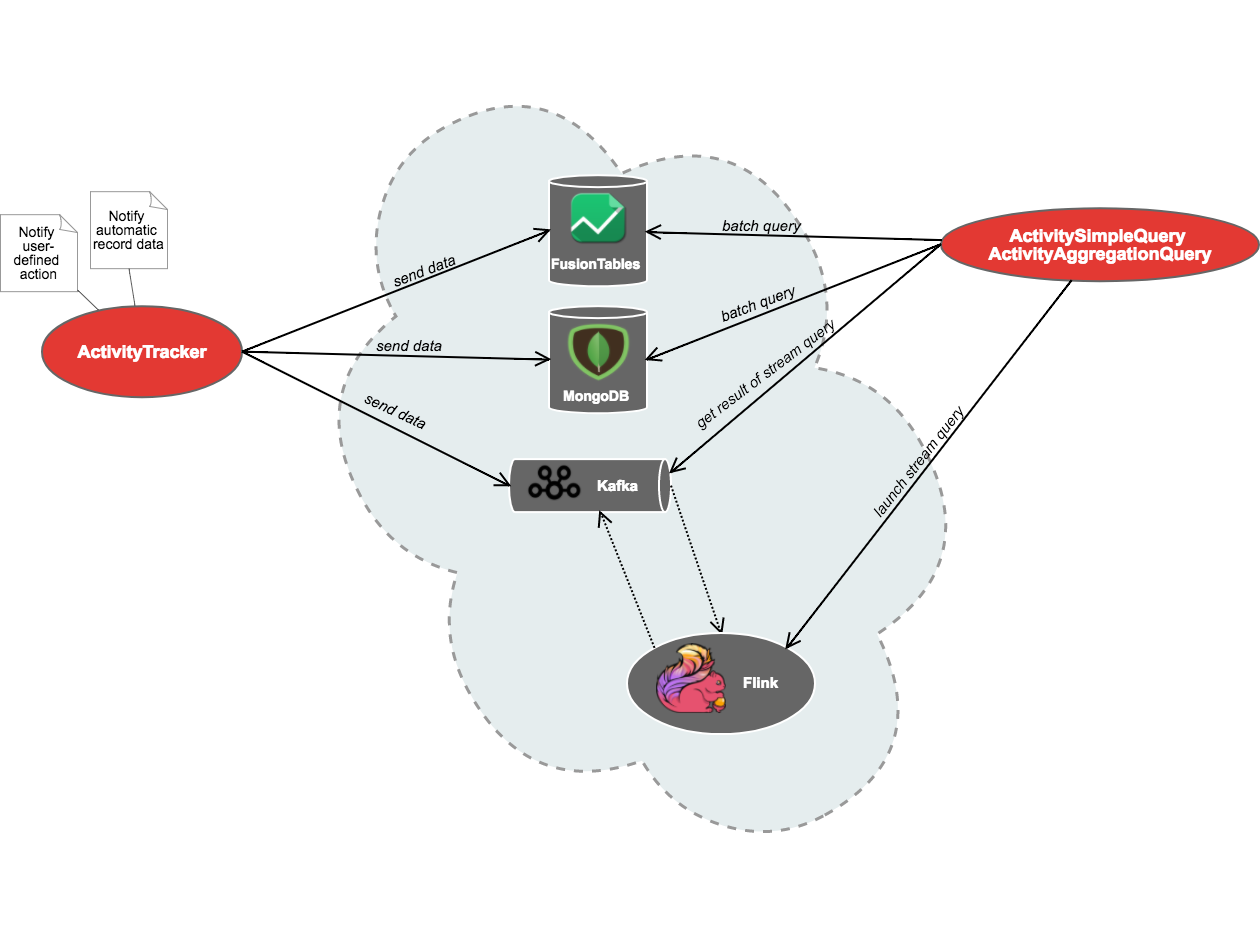
VEDILS includes several modules that give educators the opportunity to include LA in their mobile applications


Setting up the data storage service


The Learning Analytics capabilities included in VEDILS provides support for the data collection process of the users' interaction. At the moment, Google Fusion Tables and MongoDB is used for this purpose, providing cloud storage and basic support for analytics. In order to use Fusion Tables we need a table to store data and an user with some permissions to insert the information collected from VEDILS.


Steps required to configure Fusion Tables:
  • Open the FusionTable base template here
  • Once the data table is opened, we need to sign in with our Google credentials (using the correspongin link at the top right of the screen
  • Make a copy of this table using the option File - Make a Copy
  • If desired, we can change the table name to a more descriptive one, by using the option File-Rename...
  • Share this new table by clicking the Share button and then invite (with editing permissions) to the following VEDILS user: activitytracker-vedils@activitytracker-vedils.iam.gserviceaccount.com
  • Additionally, we need to change who has access to this data table. To do this, we must change the permissions to Anyone with the link (No sign-in required)
  • Finally, we need to obtain the identifier of the table which will be used later to configure the data capturing proccess. That information can be found in File - About this table - Id
In the following video (in spanish), we can see how to set up the Fusion Table service.


Steps required to configure MongoDB:
  • We have configured an internal WS to work with MongoDB, so to work using this storage mode, just choose a name for your database in the ActivityTracker component.

Capturing user's activities with ActivityTracker


The ActivityTracker component allows to automatically send data when a function of any VEDILS' component is invoked, a certain event is received or if the value of a property in another component is read or modified. ActivityTracker is able to capture the action that happened, the name of the concerned component and the corresponding input and output data, among others.

Additionally, ActivityTracker provides the app designer with the following data: date and time when the event occurred, identifiers of the application and screen where the event was generated, IP and MAC addresses of the device, IMEI, user identifier (if previously defined) and geolocation (latitude and longitude).

This component has a wide range of configuration options for the data collection process, such as the communication mode (only WIFI or indifferent), the synchronization mode (real time, on-demand or batch), and the events, properties and functions of each of the components to be tracked. This setup options allows app designer to manage the data traffic generated by the monitoring system. In the following video (in spanish), we can see how to configure the ActivityTracker component and view the data collected in Fusion Tables.


Processing and visualizating user's activities


Two components to issue queries to the storage service (currently FusionTables) and to retrieve information have been developed in order to analyze the data collected by the ActivityTracker component:

  • ActivitySimpleQuery: this component allows the application designer to select which data want to use from those captured by the ActivityTracker component. Additionally, the app designer may indicate through the Blocks view of VEDILS how to filter the data according to several attributes such as the application ID, the screen ID, the component ID, the action occurred or the user involved.
  • ActivityAggregationQuery: this component allows the user to aggregate certain fields. The aggregation operators currently available are count, maximum, minimum, sum and average.

Simple dashboards for comparing students' activities with both the expected ones or their mates' activities can be developed with VEDILS in order to contribute to the development of interventions. For that, the following components have been developed:

  • Chart: this component allows the creation of simple graphics such as pie, line or bar charts. The application designer has to indicate the data source to use by linking with an ActivitySimpleQuery or an ActivityAggregationQuery.
  • DataTable: this component allows to represent information in a tabular format from a data query.

In the following videos, we can see how to configure the above components to create two sample analytical apps.


Step-by-step tutorials